Fil:Prime number theorem ratio convergence.svg
Hoppa till navigering
Hoppa till sök

Storleken för denna PNG-förhandsvisning av denna SVG-fil: 250 × 160 pixlar. Andra upplösningar: 320 × 205 pixlar | 640 × 410 pixlar | 1 024 × 655 pixlar | 1 280 × 819 pixlar | 2 560 × 1 638 pixlar.
Originalfil (SVG-fil, standardstorlek: 250 × 160 pixlar, filstorlek: 87 kbyte)
Sammanfattning
| Beskrivning |
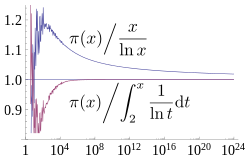
English: A plot showing how two estimates described by the prime number theorem, and converge asymptotically towards , the number of primes less than x. The x axis is and is logarithmic (labelled in evenly spaced powers of 10), going up to 1024, the largest for which is currently known. The former estimate converges extremely slowly, while the latter has visually converged on this plot by 108. Source used to generate this chart is shown below. |
| Datum | |
| Källa | Eget arbete |
| Skapare | Dcoetzee |
| SVG utveckling |


Licensiering
Jag, upphovsrättsinnehavaren av detta verk, publicerar härmed det under följande licens:
| Denna fil har gjorts tillgänglig under licensen Creative Commons CC0 1.0 Universal Public Domain Dedication. | |
| Personen som kopplade ett verk till detta dokument har tillägnat arbetet till Allmänheten genom att, i den utsträckning som tillåts i lag, avstå från alla sina rättigheter till verket i hela världen som han eller hon skulle haft för verket enligt upphovsrätten och alla relaterade eller närliggande juridiska rättigheter. Du kan kopiera, modifiera, sprida och visa upp verket, även för kommersiella ändamål, utan att fråga efter godkännande från upphovsmannen.
|
Source
All source released under CC0 waiver.
Mathematica source to generate graph (which was then saved as SVG from Mathematica):
(* Sample both functions at 600 logarithmically spaced points between \
1 and 2^40 *)
base = N[E^(24 Log[10]/600)];
ratios = Table[{Round[base^x],
    N[PrimePi[Round[base^x]]/(base^x/(x*Log[base]))]}, {x, 1,
    Floor[40/Log[2, base]]}];
ratiosli =
  Table[{Round[base^x],
    N[PrimePi[
       Round[base^x]]/(LogIntegral[base^x] - LogIntegral[2])]}, {x,
    Ceiling[Log[base, 2]], Floor[40/Log[2, base]]}];
(* Supplement with larger known PrimePi values that are too large for \
Mathematica to compute *)
LargePiPrime = {{10^13, 346065536839}, {10^14, 3204941750802}, {10^15,
     29844570422669}, {10^16, 279238341033925}, {10^17,
    2623557157654233}, {10^18, 24739954287740860}, {10^19,
    234057667276344607}, {10^20, 2220819602560918840}, {10^21,
    21127269486018731928}, {10^22, 201467286689315906290}, {10^23,
    1925320391606803968923}, {10^24, 18435599767349200867866}};
ratios2 =
  Join[ratios,
   Map[{#[[1]], N[#[[2]]]/(#[[1]]/(Log[#[[1]]]))} &, LargePiPrime]];
ratiosli2 =
  Join[ratiosli,
   Map[{#[[1]], N[#[[2]]]/(LogIntegral[#[[1]]] - LogIntegral[2])} &,
    LargePiPrime]];
(* Plot with log x axis, together with the horizontal line y=1 *)
Show[LogLinearPlot[1, {x, 1, 10^24}, PlotRange -> {0.8, 1.25}],
 ListLogLinearPlot[{ratios2, ratiosli2}, Joined -> True],
 LabelStyle -> FontSize -> 14]
LaTeX source for labels:
$$ \left.{\pi(x)}\middle/{\frac{x}{\ln x}}\right. $$
$$ \left.{\pi(x)}\middle/{\int_2^x \frac{1}{\ln t} \mathrm{d}t}\right. $$
These were converted to SVG with [1] and then the graph was embedded into the resulting document in Inkscape. Axis fonts were also converted to Liberation Serif in Inkscape.
Filhistorik
Klicka på ett datum/klockslag för att se filen som den såg ut då.
| Datum/Tid | Miniatyrbild | Dimensioner | Användare | Kommentar | |
|---|---|---|---|---|---|
| nuvarande | 21 mars 2013 kl. 14.07 | | 250 × 160 (87 kbyte) | wikimediacommons>Dcoetzee | Change n to x to match article |
Filanvändning
Följande sida använder den här filen: