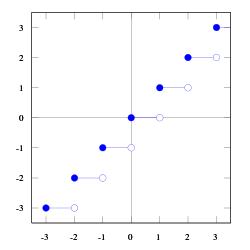
Fil:Floor function.svg
Hoppa till navigering
Hoppa till sök

Storleken för denna PNG-förhandsvisning av denna SVG-fil: 600 × 600 pixlar. Andra upplösningar: 240 × 240 pixlar | 480 × 480 pixlar | 768 × 768 pixlar | 1 024 × 1 024 pixlar | 2 048 × 2 048 pixlar | 1 000 × 1 000 pixlar.
Originalfil (SVG-fil, standardstorlek: 1 000 × 1 000 pixlar, filstorlek: 16 kbyte)
Sammanfattning
| Beskrivning | |
| Datum | 30 mars 2006 (ursprungligt uppladdningsdatum) |
| Källa | Eget arbete |
| Skapare | Ingen maskinläsbar skapare angavs. Omegatron (diskussion · bidrag) antaget (baserat på upphovsrättsanspråk). |
| Andra versioner |
|
| SVG utveckling |


Licensiering
Created by User:Omegatron using gnuplot, possibly with post-processing in the GIMP (PNG) or Inkscape (SVG)
Jag, upphovsrättsinnehavaren av detta verk, publicerar härmed det under följande licenser:
Denna fil har gjorts tillgänglig under licenserna Creative Commons Erkännande-DelaLika 3.0 Unported, 2.5 Generisk, 2.0 Generisk och 1.0 Generisk.
- Du är fri:
- att dela – att kopiera, distribuera och sända verket
- att remixa – att skapa bearbetningar
- På följande villkor:
- erkännande – Du måste ge lämpligt erkännande, ange en länk till licensen och indikera om ändringar har gjorts. Du får göra det på ett lämpligt sätt, men inte på ett sätt som antyder att licensgivaren stödjer dig eller din användning.
- dela lika – Om du remixar, transformerar eller bygger vidare på materialet måste du distribuera dina bidrag under samma eller en kompatibel licens som originalet.

|
Tillstånd ges att kopiera, distribuera och/eller modifiera detta dokument under villkoren i GNU Free Documentation License, Version 1.2 eller senare version publicerad av Free Software Foundation, utan oföränderliga avsnitt, framsidestexter eller baksidestexter. En kopia av licensen ingår i avsnittet GNU Free Documentation License. |
Du får själv välja den licens du vill använda.
(In short, this means that you can copy and modify the image freely as long as you provide attribution; preferably in the form of a link back to this page.)
Instructions
See Wikipedia graph-making tips.
 # Set square 1000×1000 SVG output and filename
 # The font size (fsize) sets the size for the circles, too.
 set terminal svg enhanced size 1000 1000 fname "Times" fsize 36
 set output "floor.svg"

 # Set the text value for missing entries in the data file, so we can plot a [[w:discontinuous function|discontinuous function]]
 set datafile missing "Skip"

 # Set y axis limits so the plot doesn't go right to the edges of the graph
 set yrange [-3.5:3.5]
 # Set x axis limits so the first and last points are hidden
 set xrange [-3.5:3.5]

 # No legend needed
 set nokey

 # Add lightly-colored axis lines
 set yzeroaxis
 set xzeroaxis

 # Plot as lines and also points (circles)
 plot "floor.dat" with lines
 plot "floor.dat" with points 1 6

 # Close the file (so I don't have to close gnuplot to view it)
 set output
and data file:
floor.dat
#  X     Y1
   -3    -4
   Skip
   -3    -3
   -2    -3
   Skip
   -2    -2
   -1    -2
   Skip
   -1    -1
   0     -1
   Skip
   0     0
   1     0
   Skip
   1     1
   2     1
   Skip
   2     2
   3     2
   Skip
   3     3
   4     3
Then I opened the resulting SVG file in Inkscape, changed the fill style for the circles (either blue or white fill), brought the plot lines to the top, and then brought the circles to the top (over the lines).
External links
Filhistorik
Klicka på ett datum/klockslag för att se filen som den såg ut då.
| Datum/Tid | Miniatyrbild | Dimensioner | Användare | Kommentar | |
|---|---|---|---|---|---|
| nuvarande | 22 maj 2006 kl. 01.05 | | 1 000 × 1 000 (16 kbyte) | wikimediacommons>Omegatron | i like blue better |
Filanvändning
Följande sida använder den här filen: